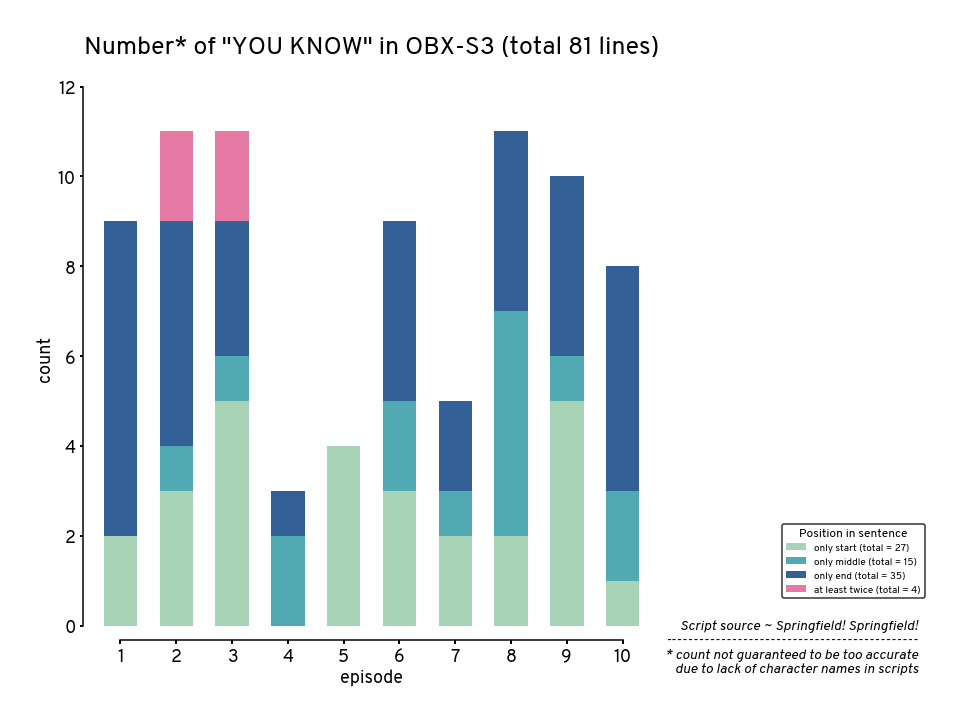
“Outer Banks” Season 3 - you know
This notebook visualizes the number of “you know” from Season 3 of the TV show “Outer Banks”
Source code: https://
Motivation
Why? cuz When you know, you know. You know?
This is because the character Carlos Singh (newly introduced in season 3) says that way too much, almost as if it’s a gag from the writers. Sometime he would even start and end a sentence with it. So I just had to count this.
Unfornately, the only data source I could find for transcripts is Springfield! Springfield! (see below), which sadly do not contain the names of the characters for each line.
But Mr. Singh usually says it with a pause, which can be signified by commas. That makes things a bit easier but not perfect, hence the counts & visualizations below are only for fun.
Obtain data
The data file outer-banks-2020_scripts.json was obtained using sf2 that downloaded the scripts from Springfield! Springfield!.
sf2 --show "outer-banks-2020" --season 3 --format jsonImport modules
Source
import numpy as np
import pandas as pd
import re

import matplotlib.pyplot as plt
import seaborn as sns
Source
from matplotlib import rcParams
rcParams['font.family'] = 'Overpass Nerd Font'
rcParams['font.size'] = 18
rcParams['axes.titlesize'] = 25
rcParams['axes.labelsize'] = 18
rcParams['axes.linewidth'] = 1.5
rcParams['lines.linewidth'] = 1.5
rcParams['lines.markersize'] = 20
rcParams['patch.linewidth'] = 1.5
rcParams['xtick.labelsize'] = 18
rcParams['ytick.labelsize'] = 18
rcParams['xtick.major.width'] = 2
rcParams['xtick.minor.width'] = 2
rcParams['ytick.major.width'] = 2
rcParams['ytick.minor.width'] = 2
rcParams['savefig.dpi'] = 300
rcParams['savefig.transparent'] = False
rcParams['savefig.facecolor'] = 'white'
rcParams['savefig.format'] = 'svg'
rcParams['savefig.pad_inches'] = 0.5
rcParams['savefig.bbox'] = 'tight'
Load and count
Source
def you_know_line(line):

    og_line = line.strip()
    line = og_line.lower()

    out = dict(
        has_start = bool(re.findall(r'^\s*you\s+know\s*,', line)),
        has_middle = bool(re.findall(r',\s*you\s+know\s*,.?', line)),
        has_end = bool(re.findall(r',\s*you\s+know[\.\?\!]?$', line)),
    )

    if sum(list(out.values())) == 0:
        return None

    out['line'] = og_line
    return out


def you_know_script(row):
    script = row['script']
    const = {k: row[k] for k in ['episode']}

    yks = []
    for lino, line in enumerate(script.split('\n')):
        yk = you_know_line(line)
        if yk is not None:
            yk['line_index'] = lino
            yks.append(yk)

    yk = pd.DataFrame(yks).assign(**const)
    return yk
df = pd.read_json('outer-banks-2020_scripts.json')
df = pd.concat(df.apply(you_know_script, axis=1).to_list(), ignore_index=True)\
.sort_values(['episode','line_index']).reset_index(drop=True)
dfdf.filter(regex='has.*').sum(axis=0)has_start 31
has_middle 16
has_end 38
dtype: int64df.filter(regex='has.*').sum(axis=1).value_counts()1 83
2 1
dtype: int64Clean counts
There were sentences that actually should have been considered one, hence the following attempts to clean and merge some of them
Source
def merge_line(edf):
    merged_lines = dict()

    rows = edf.to_dict('records')
    for r1, r2 in zip(rows[:-1], rows[1:]):
        if (l2:=r2['line_index']) - (l1:=r1['line_index']) > 1:
            continue
        overlap_pos = any([
            r1[k] and r2[k]
            for k in ['has_start','has_middle','has_end']
        ])
        if overlap_pos:
            continue

        assert l1 not in merged_lines and\
            l2 not in merged_lines

        merged_lines[l1] = (l1+l2)/2
        merged_lines[l2] = (l1+l2)/2

    edf['merged_line'] = edf['line_index'].apply(
        lambda x: merged_lines.get(x, x)
    )
    edf['merged'] = edf['line_index'].apply(
        lambda x: x in merged_lines
    )

    return edf
df = df.groupby('episode').apply(merge_line)
mdf = df.groupby(['episode', 'merged_line']).agg(list).reset_index()
for k in ['has_start','has_middle','has_end','merged']:
mdf[k] = mdf[k].apply(any) mdf.filter(regex='has.*').sum(axis=0)has_start 31
has_middle 16
has_end 38
dtype: int64 mdf.filter(regex='has.*').sum(axis=1).value_counts()1 77
2 4
dtype: int64mdf['has_min_twice'] = mdf.filter(regex='has.*').sum(axis=1) > 1
mdf.query('has_min_twice == True')mdf.loc[mdf['has_min_twice'], ['has_start','has_middle','has_end']] = False # avoid double countingmdf.filter(regex='has.*').sum(axis=0)has_start 27
has_middle 15
has_end 35
has_min_twice 4
dtype: int64mdf.filter(regex='has.*').sum(axis=1).value_counts()1 81
dtype: int64Final dataframe for visualization
The data frame is cumulative to facilitate stacked bars
Source
total_cnt = mdf.filter(regex='has*|episode')\
    .groupby('episode')\
    .agg(sum).sum(axis=0).to_dict()

total = len(df)

df_viz = mdf.filter(regex='has*|episode')\
    .groupby('episode')\
    .agg(sum)

df_viz.columns = df_viz.columns.map(lambda x: x.replace('has_',''))

df_viz = df_viz.cumsum(axis=1)
Source
rename_dict = {
    'start': 'only start',
    'middle': 'only middle',
    'end': 'only end',
    'min_twice': 'at least twice'
}

df_viz = df_viz.rename(
    columns=rename_dict
).reset_index()

sentence_positions = list(rename_dict.values())
df_viztotal_cnt = {
rename_dict[k.replace('has_', '')]: v
for k, v in total_cnt.items()
}
total = len(mdf)Visualization
Source
colors = {
    'only start': "#a1dab4",
    'only middle': "#41b6c4",
    'only end': "#225ea8",
    'at least twice': "#f768a1"
}


plt.figure(figsize=(10,10))
for pos in np.array(sentence_positions)[::-1]:
    sns.barplot(
        data = df_viz,
        x = 'episode',
        y = pos,
        color=colors[pos],
        label=pos + ' (total = %d)' %(total_cnt[pos]),
        width=0.6

    )

# plt.legend(title='position', markerfirst=False)
handles, labels = plt.gca().get_legend_handles_labels()
order = [3,2,1,0]
plt.legend(
    [handles[idx] for idx in order],[labels[idx] for idx in order],
    title='Position in sentence',
    frameon=True,
    loc='lower right',
    bbox_to_anchor=(1.5, 0.05),
    title_fontsize='large',
    edgecolor='black',
)
plt.ylabel('count')
plt.title(f'Number* of "YOU KNOW" in OBX-S3 (total {total} lines)', y=1.05)
plt.ylim([-0.1,12])
sns.despine(trim=True, offset=10)

plt.text(
    1.48, 0.02,
    'Script source ~ Springfield! Springfield!\n' +\
    '-'*46 + '\n' +\
    '* count not guaranteed to be too accurate\n' +\
    'due to lack of character names in scripts'
    ,
    transform=plt.gca().transAxes,
    fontsize=14,
    verticalalignment='top',
    horizontalalignment='right',
    style='italic',
)

plt.savefig('you-know-cnt.svg')
plt.savefig('you-know-cnt.png')
plt.show()